You need to do diligent product research in order to identify profitable categories on Amazon. This includes looking for Amazon best sellers to identify products with high demand, low competition, and great margins.
While it may seem simple enough, the sheer number of options on Amazon can make it difficult for sellers to stand out. This is why actionable data is crucial when doing product research, as selling what you want to sell may not always pay off.
This article will guide you through the process of:
- Using ScraperAPI to collect Amazon product data
- Transforming Amazon raw product data into JSON format
- Analyzing Amazon data to get actionable insights
- Helping you identify the most profitable products and categories for your Amazon business
Ready to get started? Let’s begin!
ScraperAPI handles data transformation for you with a simple API call. Submit an Amazon product ASIN or query and get structured data in return.
Finding a Product to Sell on Amazon
If you are looking for a winning Amazon product to sell, we recommend starting with a clear direction. Identify your niche and product goals before starting to source for products. No matter how popular the category is, there are always profitable sub-categories within every niche.
Factors to Consider for Selecting the Best Items to Sell on Amazon
We all want to choose a product that will become a huge success once it hits the shelf. But what aspects should we consider? When identifying top-selling products on Amazon, it’s essential to gather the following relevant data:
- High Demand: High search volume and a strong sales rank are clear market demand indicators. The easiest way to find out what is popular and trending on Amazon is to check the ‘best-sellers,’ ‘most-wished,’ or ‘new arrivals list.’
- Competition: Ideally, you want to enter a market with less competition. This makes it easier to gain a foothold and potentially achieve higher profits. Niches where the top sellers have received less than 400 reviews have a higher likelihood of being noticed. Remember, less competition translates to improved chances of capturing market share.
- Price point: Products priced between $25 and $70 often have the best profit margins. Lower-cost items potentially attract more buyers while still allowing for healthy profits. Shipping, storage, and returns are also factors in profitability decisions, so keep them in mind.
- Size and Weight: Smaller, lighter items are generally cheaper to ship and store, making them more profitable. Choose products that weigh less than 5 lbs and whose size measures less than 18”x14”x8”. They tend to have lower return rates and are easier to handle in terms of packaging and logistics.
- Seasonal products: Consider products with consistent demand throughout the year. While seasonal products can be profitable, year-round demand provides more stable income. For example, holiday-related items may sell well during specific times of the year, but you need to ensure that your product strategy accounts for these fluctuations.
- Customer ratings and reviews: Products with positive feedback tend to perform better. High ratings can boost your product’s visibility and credibility. Reviews provide valuable insights into what customers like or dislike, offering clues on how to differentiate your product from others.
Pro tip:
Consider product bundling within your chosen niche. For example, if you’re selling portable vacuum cleaners, also offer complementary accessories. This strategy, known as product bundling, can significantly increase your Average Order Value (AOV) and provide additional value to customers.
Luckily, with the vast amounts of data available online, we can do some analysis to get a general idea of the market. Let’s take a look at how we can use data to fuel our knowledge base for selecting the best items.
Extracting Amazon Product Data using ScraperAPI
Now, let’s get into the technical part. For this example, I decided to target shavers — a type of product that generally experiences high demand and consistent sales year-round (given the fact people groom themselves on a regular basis).
Shavers are a good starter product, as they tend to be small and light (making it easier/cheaper for you to ship), within your target price range ($20– $70 is generally the best place to start at selling on Amazon FBA) while also offering decent profit margins.

To identify the exact number of sellers and conduct proper market research, I need to look at multiple data points, including ASINs, prices by different seller names with their brands, reviews, and even shipping weights.
Since at least thousands of shavers were listed on Amazon, collecting this data manually would simply be impractical.
To make it easier, I used ScraperAPI to scrape data in bulk from Amazon’s web pages without getting blocked.
ScraperAPI helps you avoid getting your IP banned by rotating IP addresses, generating matching headers and cookies for those proxies, handling CAPTCHAs, transforming Amazon data into JSON or CSV, and managing request limits.
It simplifies the entire scraping process by providing reliable access to web pages, ensuring you can focus on gathering and analyzing the data without worrying about anti-scraping measures that Amazon might deploy.
Prerequisites
Before jumping into our analysis, setting up your environment with the necessary tools and libraries is crucial. Ensure you have met the following prerequisites:
-
- Python (version 3.8 or newer) is installed on your system
-
Create a free ScraperAPI account to access your API key and 5,000 API credits
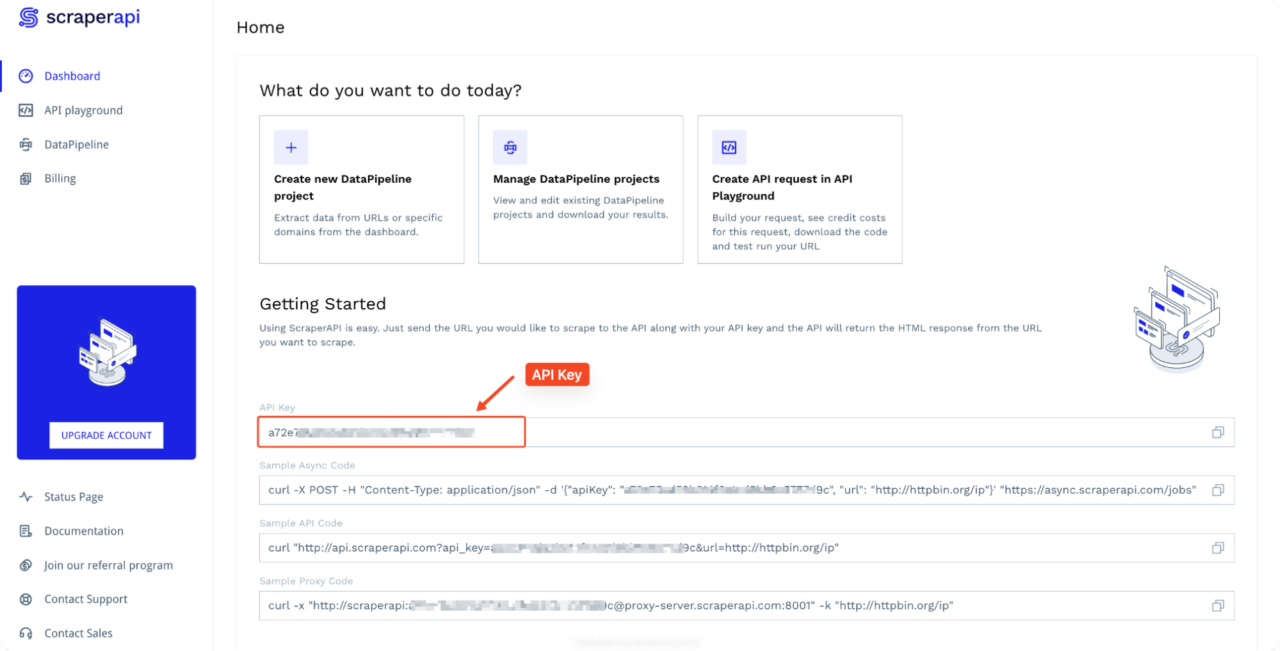
With these two conditions met, let’s proceed to set up a virtual environment to avoid any conflicts with existing Python modules or libraries.
For macOS users:
  pip install virtualenv
  python3 -m virtualenv venv
  source venv/bin/activate
For Windows users:
  pip install virtualenv
  virtualenv venv
  source venv\Scripts\activate
Once your virtual environment is activated, you can proceed to install the required libraries:
pip install requests pandas matplotlib seaborn
Step 1: Scraping ASINs from Amazon
We first need to collect ASINs (Amazon Standard Identification Numbers) for products in a specific category to find the most profitable products. To simplify the process, we will use ScraperAPI’s Amazon Search endpoint to collect product ASINs from any Amazon search result page.
To do this, send your get() request to the endpoint alongside your API key and query. ScraperAPI will handle the rest.
The endpoint will return all products listed in JSON format, allowing you to extract specific data points using key-value pairs.
To get the name and ASIN from the products, target the keys name and asin.
  import requests
	import json

	APIKEY = "your_api_key"
	QUERY = "shavers"
	COUNTRY = "us"
	TLD = "com"
	PAGES = 4

	all_asins = set()  # Using a set to automatically handle duplicates

	for page in range(1, PAGES + 1):
		payload = {
			'api_key': APIKEY,
			'query': QUERY,
			'country': COUNTRY,
			'tld': TLD,
			'page': str(page)
		}

		r = requests.get('https://api.scraperapi.com/structured/amazon/search', params=payload)
		data = r.json()
		new_asins = set()

		if 'results' in data:
			page_asins = {item['asin'] for item in data['results'] if 'asin' in item}
			new_asins = page_asins - all_asins  # Find ASINs not already in all_asins
			all_asins.update(new_asins)  # Add new ASINs to all_asins

		print(f"Fetched ASINs from page {page}. New unique ASINs: {len(new_asins)}")

	# Convert set to list for JSON serialization
	unique_asins = list(all_asins)

	# Write unique ASINs to a JSON file
	with open('Amazon_shavers_unique_asins.json', 'w') as f:
		json.dump(unique_asins, f, indent=4)

	total_asins = len(unique_asins)
	print(f"Total number of unique ASINs collected: {total_asins}")
	print("Unique ASINs have been stored in JSON format.")
Note: Check the Amazon Search Endpoint documentation to learn more.
This code sends a get() request to the Amazon Search endpoint with "shavers" as our query. The request includes your API key, the country code, and the top-level domain (TLD), and it iterates through multiple pages of search results.
The data retrieved from each page is parsed to extract ASINs, which are then stored in a set to automatically handle any duplicates.
As the loop processes each page, the ASINs from the current page are compared to the existing ASINs in the set to identify the unique ASINs. These unique ASINs are added to the set, ensuring that we don’t have any repeated values.
Once all pages have been processed, the unique ASINs are converted to a list for JSON serialization and saved to a file named Amazon_shavers_unique_asins.json.
  [
  "B0039LMTAQ",
  "B0BPZR1MBC",
  "B00U0X2T1U",
  "B002TQ4AO0",
  "B07Y5MZ1R7",
  "B0D4DC3GMS",
  "B07Q1FL7ZF",
  "B09NX75HRG",
  "B06X9NWGBX",
   Truncated data...
]
Note: Learn more about ScraperAPI’s Amazon Search endpoint.
Step 2: Scraping Detailed Product Data
Now that we have our lists of ASINs, we can use the Structured Data Endpoint to get the detailed product information for each ASIN we need for our analysis.
Resource: Read more about our Structured Data Endpoint and Scraping Amazon with it.
  import requests
  import json

  APIKEY = "your_api_key"
  COUNTRY = "us"

  # Read ASINs from the file
  with open('Amazon_shavers_unique_asins.json', 'r') as f:
      asins = json.load(f)

  all_products = []

  for index, asin in enumerate(asins, 1):
      payload = {
          'api_key': APIKEY,
          'asin': asin,
          'country': COUNTRY,
      }

      try:
          r = requests.get('https://api.scraperapi.com/structured/amazon/product', params=payload)
          r.raise_for_status()  # Raise an exception for bad status codes
          product_data = r.json()
          all_products.append(product_data)
          print(f"Scraped product {index}/{len(asins)}: ASIN {asin}")
      except requests.exceptions.RequestException as e:
          print(f"Error scraping ASIN {asin}: {str(e)}")

  # Write all product data to a JSON file
  with open('Amazon_shavers_product_data.json', 'w', encoding="utf-8") as f:
      json.dump(all_products, f, indent=4)

  print(f"Scraped data for {len(all_products)} products.")
  print("Product data has been stored in 'Amazon_shavers_product_data.json'.")
Now, we read the list of ASINs from the Amazon_shavers_unique_asins.json file created in the previous step. We then iterate through each ASIN and send a get() request to ScraperAPI’s Amazon Product Page SDE. This request then retrieves detailed information about each product based on its ASIN.
For each product, the response data is parsed into JSON format, and the product information is appended to a list called all_products. Once all ASINs have been processed, the complete set of detailed product data is written to a JSON file named Amazon_shavers_product_data.json.
  [
  {
      "name": "Gillette Venus Sensitive Women's Disposable Razors - Single Package of 3 Razors",
      "product_information": {
          "is_discontinued_by_manufacturer": "No",
          "product_dimensions": "4.13 x 1.16 x 8.19 inches; 2.1 ounces",
          "item_model_number": "4740031389",
          "upc": "885781058859 047400313897 047400143562",
          "manufacturer": "Gillette Venus",
          "asin": "B0039LMTAQ",
          "country_of_origin": "USA",
          "best_sellers_rank": [
              "#123 in Beauty & Personal Care (See Top 100 in Beauty & Personal Care)",
              "#3 in Women's Disposable Shaving Razors"
          ],
          "customer_reviews": {
              "ratings_count": 25,
              "stars": 4.6
          }
      },
      "brand": "Visit the Gillette Venus Store",
      "brand_url": "https://www.amazon.com/stores/Venus/page/E7EB0478-AED4-4B67-A892-93EAE5E8CD6B?ref_=ast_bln&store_ref=bl_ast_dp_brandLogo_sto",
      "full_description": "Gillette Venus Sensitive Disposable Razor is a 3 bladed razor designed for women with sensitive skin. The razor features the SkinElixir lubrastrip and 3 curve-hugging blades for a smooth shave with up to 0% irritation. (US Consumer Study, Feb. 2018)",
      "pricing": "$6.94",
      "list_price": "$6.94",
      "shipping_price": "FREE",
      "shipping_time": "Sunday, August 25",
      "shipping_condition": "Sunday, August 25",
      "shipping_details_url": "/gp/help/customer/display.html?nodeId=GZXW7X6AKTHNUP6H",
      "availability_status": "In Stock",
      "is_coupon_exists": false,
      "images": [
          "https://m.media-amazon.com/images/I/41Rs01cZosL.jpg",
          "https://m.media-amazon.com/images/I/41Bq1dvK-AL.jpg",
          "https://m.media-amazon.com/images/I/416zZBhglmL.jpg",
          "https://m.media-amazon.com/images/I/41usmeseaoL.jpg",
          "https://m.media-amazon.com/images/I/41uWASeRHcL.jpg",
          "https://m.media-amazon.com/images/I/41XJzB5xYFL.jpg",
          "https://m.media-amazon.com/images/I/41DioilM0qL.jpg"
      ],
      "product_category": "Beauty & Personal Care \u203a Shave & Hair Removal \u203a Women's \u203a Razors & Blades \u203a Disposable Razors",
      "average_rating": 4.6,
      "feature_bullets": [
          "3 BLADES: 3 blades and a SkinElixir lubrastrip for glide, to deliver a smooth shave, with up to 0% irritation (US Consumer Study Feb 2018)",
          "Moisture Rich Strip with more lubricants for a great glide on your sensitive skin vs original Venus disposable razors",
          "3 razor blades surrounded by soft protective cushions",
          "Pivoting rounded head to fit easily into hard to shave areas",
          "Specially designed handle for great control",
          "No razor blade change required; just use and toss"
      ],
      "total_reviews": 25716,
      "model": "4740031389",
      "ships_from": "Amazon.com",
      "sold_by": "Amazon.com",
      "aplus_present": true
  }, Truncated data...
]
This file contains all the essential product details that we will now analyze to make informed decisions about which shavers to sell on Amazon.
Step 3: Cleaning Up and Preparing the Data
After collecting our data using ScraperAPI, we need to clean and prepare it for analysis. The raw JSON data we obtained includes several elements that are either unnecessary or could cause issues during the analysis, such as long product names, extra text in the brand name field, and prices stored as strings because a “$” sign prefixes every number.
Furthermore, some columns have data that do not add any value to our analysis (e.g., images), and we may need to exclude those to simplify our dataset.
Converting JSON to CSV
First, we need to convert the JSON data into a CSV format, which is more convenient for data analysis. We will be using the pandas library for easy manipulation of tabular data.
  import pandas as pd
  import json

  # Load the JSON data from the file
  with open('second_Amazon_shavers_product_data.json', 'r') as f:
      data = json.load(f)

  # Convert JSON to DataFrame
  df = pd.json_normalize(data)


  df.to_csv('Amazon_shavers_product_data.csv', index=False)
The resulting CSV file will have all the data points from the JSON, making it easier to clean and analyze.
Pro Tip:
ScraperAPI now provides an
output_formartparameter that lets you get CSV data instead of the default JSON format. Just setoutput_formattocsv, and ScraperAPI will return all data in tabular format. No need for extra steps.
Cleaning the Data
Next, we’ll clean up the data and select only the columns we need for our analysis so that our CSV file looks like this:
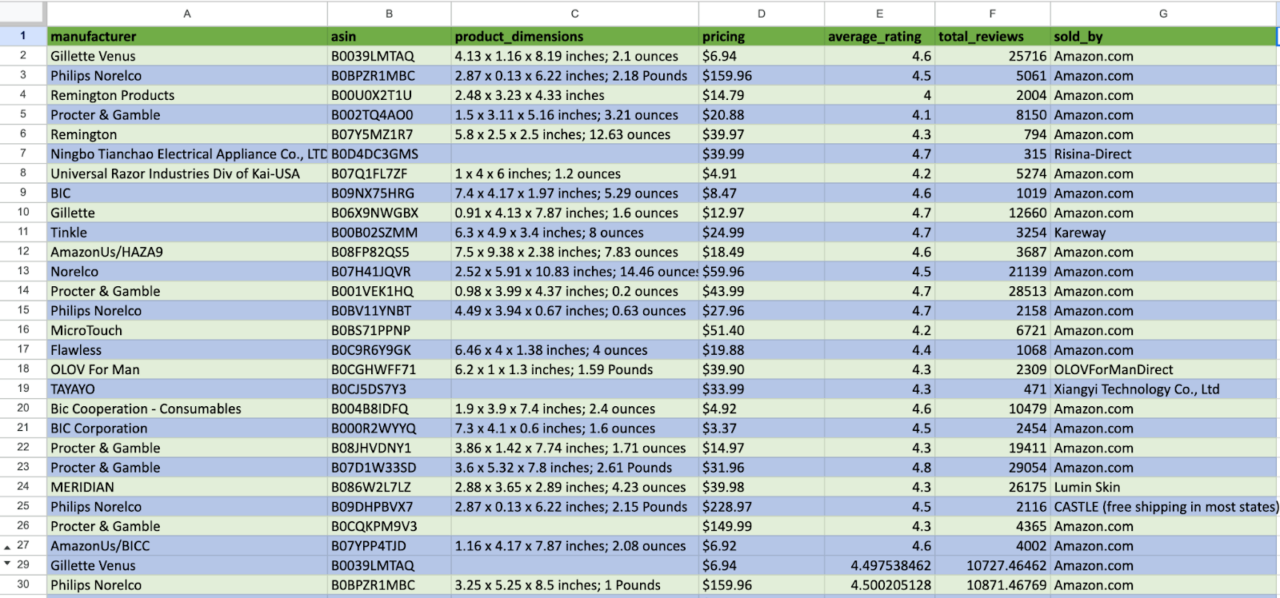
  df = pd.read_csv('Amazon_shavers_product_data.csv')

  # Convert pricing to float
  df['pricing'] = df['pricing'].str.replace('$', '').astype(float)

  # Extract manufacturer from product information
  df['manufacturer'] = df['product_information'].apply(lambda x: x.get('manufacturer', 'Unknown'))

  # Select and rename columns
  df_clean = df[['manufacturer', 'asin', 'product_information', 'pricing', 'average_rating', 'total_reviews', 'sold_by']]
  df_clean = df_clean.rename(columns={'product_information': 'product_dimensions'})

  # Extract product dimensions
  df_clean['product_dimensions'] = df_clean['product_dimensions'].apply(lambda x: x.get('product_dimensions', 'Unknown'))

  # Save to CSV
  df_clean.to_csv('amazon_shavers_clean.csv', index=False)
Analyzing Amazon Product Data
Now that we have the raw data, it’s time to analyze it to identify the most profitable products.
How many big brands are in the market?
Usually, people tend to trust big brands over a new/small brand that they’ve never heard of, so the first and most important aspect to consider is always competitors. Products from established brands tend to dominate certain categories, making it difficult for new entrants to compete.
However, our analysis of the shaver market on Amazon reveals an interesting dynamic. Among the 185 products in our dataset, we have identified a wide range of manufacturers with varying market shares.
Let’s visualize this distribution to get a clearer picture:
  import pandas as pd
  import matplotlib.pyplot as plt

  plt.figure(figsize=[20,17])
  df['manufacturer'].value_counts().plot(kind='pie', autopct='%.2f')
  plt.legend(title='Manufacturers')
  plt.show()
We will create a pie chart showing the market share of different manufacturers in our dataset, with each slice representing a manufacturer and its percentage share of the products in our dataset.

From the resulting pie chart, we can see that the shaver market on Amazon isn’t solely dominated by big brands. While Procter & Gamble (18.92%) and Philips Norelco (11.89%) hold significant market shares, there’s a notable presence of smaller brands and manufacturers.
Gillette Venus and Remington Products each hold 4.32% of the market, followed by smaller brands like MicroTouch, AmazonUs/BICC, MERIDIAN, and others, each occupying around 3.78% of the market share.
We can conclude that while established brands have a strong presence, the market is competitive. The smaller brands are still actively competing, which suggests that there is room for new players to enter the market and potentially carve out a niche.
Which products are in high demand on Amazon?
A shortcut to estimate the overall demands of a product is to use keyword research tools like Google Trends since when people are interested in something, they search for it first.
We analyzed Google Trends data for the past 12 months in the US. The search term “shavers” shows consistent interest throughout the year, with values mostly between 70 and 100 on the interest scale.
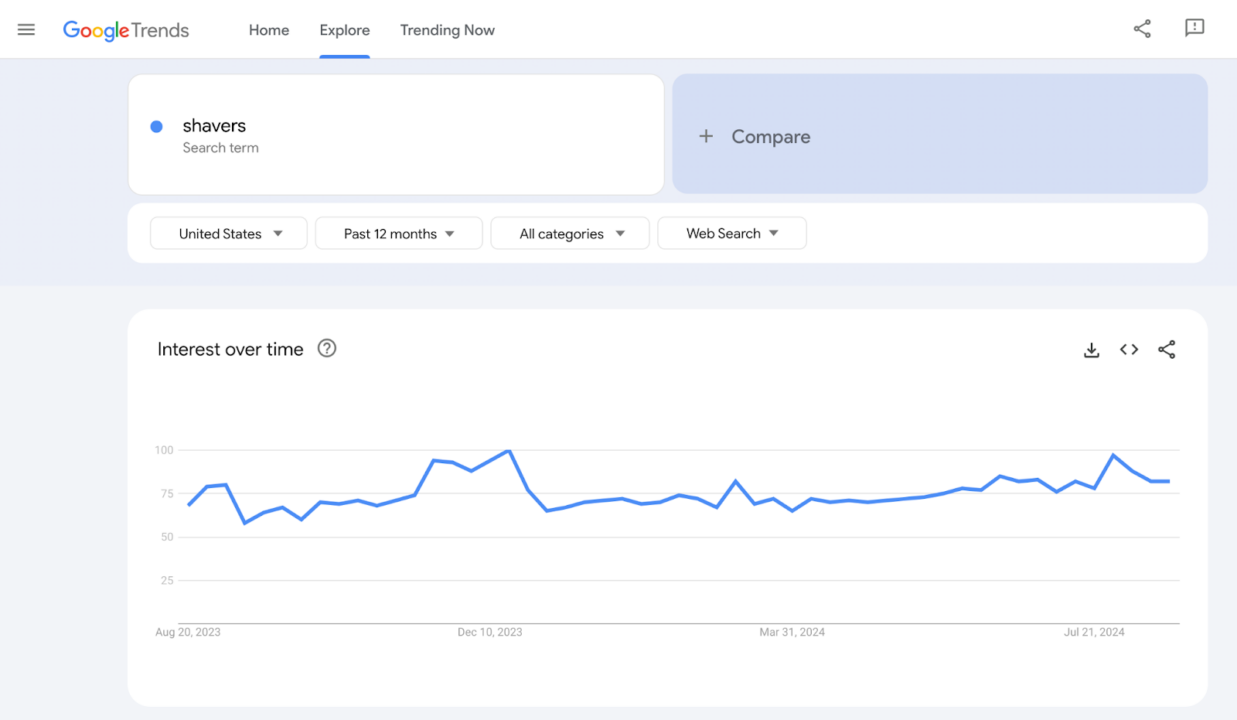
Key observations include:
- Stable year-round interest with minor fluctuations
- Slight uptick in July 2024
- Large spike around December 2023, probably Christmas shopping
This data suggests shavers have steady demand, making them a potentially stable product category for Amazon sellers. This consistent interest shows there are year-round selling opportunities, and you might even be able to pull in some holiday shoppers, too.
Sellers should Keep this stability in mind while plotting their inventory and marketing strategies.
Note: Scrape Google trends to scale this step of the process and reduce manual checks.
Analysing Customer Ratings
The product ratings tell us in a straightforward way how consumers are perceiving these brands and the products. Analyzing the average ratings across shaver manufacturers allows us to identify potential market opportunities and gauge competitors.
  import matplotlib.pyplot as plt
  import seaborn as sns

  plt.figure(figsize=(10, 6))
  sns.lineplot(x='manufacturer', y='average_rating', data=data, errorbar=None)
  plt.xticks(rotation=90)
  plt.show()

Our line chart shows a range of average ratings that fluctuate around 4.6 to 4.9, indicating that while some brands perform better than others, there isn’t a single brand that completely monopolizes the market. This suggests a competitive market where multiple brands are performing well in terms of customer satisfaction.
Ideal Pricing Strategy for Your Products
After analyzing the major competitors and evaluate the demand for your product, you may feel ready to enter the market. However, one vital question still requires an answer: how your product will be priced.
The success of your product on Amazon may heavily depend on its pricing strategy. A product priced too high compared to competitors will likely be overlooked by consumers, while one priced too low might not generate enough profit to cover costs.
To determine an optimum pricing strategy, you must look at the pricing data reflected by both large and small product brands. Let’s examine how both big and small brands price their shavers and how this correlates with their ratings.
  # Create a bar plot for average price
  plt.figure(figsize=(10, 5))
  sns.barplot(x='manufacturer', y='pricing', data=data, color='blue', label='Average Price')
  plt.ylabel('Average Price')
  plt.legend(loc='upper left')
  plt.xticks(rotation=90);

  # Create a secondary y-axis for average rating
  ax2 = plt.twinx()
  sns.lineplot(x='manufacturer', y='average_rating', data=data, color='red', marker='o', label='Average Rating', ax=ax2)
  ax2.set_ylabel('Average Rating')
  plt.legend(loc='upper right')

  # Add a title
  plt.title('Price and Rating by Manufacturer')

  # Show the plot
  plt.show()
This graph illustrates the relationship between pricing and ratings across different shaver manufacturers on Amazon.

We observe a wide range of pricing strategies, with some brands like Philips Norelco commanding higher prices (around $140) while maintaining strong ratings (about 4.7). Interestingly, brands with lower average prices, such as Gillette Venus (priced under $25), also achieve high ratings (4.7+).
This suggests that both premium and budget-friendly pricing strategies can be successful in the shaver market. For new sellers, this data indicates opportunities at various price points, provided the product quality meets customer expectations.
One important thing to bear in mind is that Amazon sellers frequently adjust their prices in response to competition. Therefore, you need to regularly monitor competitor prices to stay competitive.
Tools like ScraperAPI can automate the extraction of price data, allowing you to make timely adjustments to your pricing strategy based on the latest market trends.
Automate recurrent Amazon scraping projects using ScraperAPI’s DataPipeline.
Does it matter what Amazon category you sell in?
As you can see from the data, there are profitable sellers in every category on Amazon. Finding a category or market with limited competition won’t be easy, but it will be worth it. Again, it depends on product research, competitiveness, etc. Remember:
- Demand is more important than category
- Be different; don’t just sell in a popular category because that’s what everyone else is doing
- Amazon is very competitive — get creative!
Wrapping Up: Finding a Profitable Amazon Product
The steps and strategies outlined in this guide provide a solid foundation for choosing the right products to sell on Amazon.
With a web scraping tool like ScraperAPI, the research process is no longer tedious and time-consuming, as it automates the data scraping process and makes data collection easier, allowing you to focus more on analysis.
If you have a product in mind already, you can follow the scraping and analysis steps I covered in this guide to see whether it is the right fit.
For more insights and detailed guides on how to effectively use data in your Amazon strategy, check out these additional resources:
- How to Scrape Amazon ASINs at Scale
- How to Scrape Amazon Reviews at Scale
- How to Run an Amazon Competitive Analysis from Scratch
- How to Use Amazon Data to Gain a Competitive Edge
Until next time, happy scraping!

